Fact Sheet
Trends in Legal Representation of People Facing Deportation in U.S. Immigration Court, Q1 2024 through Q2 2026
Overview
This fact sheet presents original analysis of historical data and recent trends in the legal representation of people in deportation proceedings in U.S. immigration courts.1 We use a minimalist definition of representation here, which counts people as represented if they had representation in immigration court at some point during their case. The analyses also show representation counts and percentages for cases that have been completed along with those that are still pending. Where appropriate and feasible, we disaggregate the data by nationality, language, and state.
The data presented in this document is based on original Acacia analysis of data from the administrative Case database (Case) of the Executive Office for Immigration Review (EOIR). The purpose of this fact sheet is to present updated data on the representation status of people with removal cases before U.S. immigration court and to track a set of key metrics in historical context.
The fact sheet presents the data and explains the visualizations in ways that are clear and compelling, while guarding against misinterpretation and the drawing of erroneous or misleading inferences. Importantly, the statistics reported are descriptive in nature and readers should take care to avoid ascribing causality to the trends and patterns observed in the data.
Historical Trends in Representation
Figure 1 shows the trend in the count of deportation cases2 with representation at any point (red-orange area), those that have never had representation (aqua area), and all cases (the total area). These counts are plotted over time by the calendar year and quarter in which the Department of Homeland Security (DHS) filed the Notice to Appear (NTA) in Immigration Court; not, for example, based on the number of cases with (and without) representation during each quarter.
The number of unrepresented cases decreased between 2024 Q1 and 2026 Q2, from 319,003 to 98,481. The number of unrepresented cases fell from 319,003 cases in 2024 Q1 to a low of 43,740 cases in 2025 Q2, then recovered to 98,481 cases by 2026 Q2. In 2024 Q1, unrepresented cases (319,003) outnumbered represented cases (134,581). This difference persisted in 2026 Q2, when unrepresented cases (98,481) still outnumbered represented cases (55,426). The largest increase in unrepresented cases occurred between 2025 Q2 and 2025 Q3. Meanwhile, the share of cases without representation decreased relative to the share with representation, indicating that the gap between the two groups narrowed over time.
Figure 1. Case Representation Frequency
NTA Year 2024 Q1 to 2026 Q2
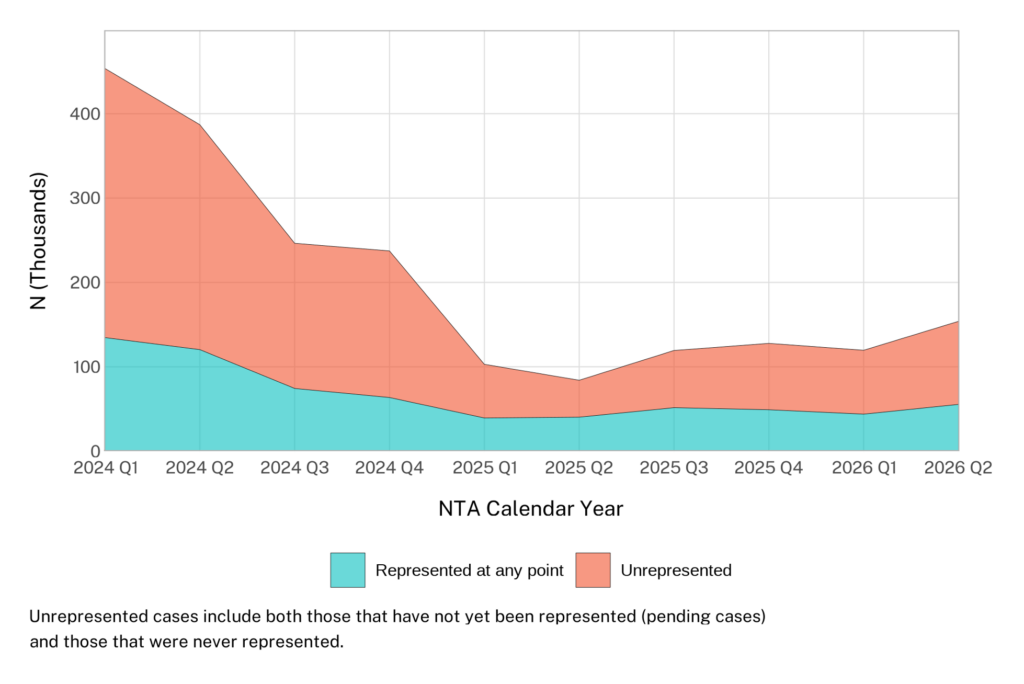
It is important to note that perhaps the most salient, overarching trend shown in Figure 1 is the large overall decline in the total number of cases with NTAs in 2024. However, there has been a gradual increase in the number of cases with NTAs filed in 2025 and the first half of 2026, without a corresponding increase in representation.
When interpreting these numbers, it is important to consider that, on aggregate, more cases within the same NTA-filing-quarter cohort procure representation each quarter. That means that a lower representation rate for cases with an NTA filed very recently should not be taken to mean that the likelihood of people getting representation at any point in their case is declining. In fact, among people with the same NTA quarter, the number and percentage with representation can only grow (or remain unchanged) as time passes.3
Figure 2. Fluctuation in Median Time to Representation
E-28 Year 2024 Q1 to 2026 Q2

The median time from an NTA date to an initial EOIR-28 (E-28, form that must be filed to authorize a practitioner to represent a respondent in immigration court)4 filing date in 2024 Q1 was a recent low of roughly 260 days. Furthermore, as shown in Figure 2, The median time from the NTA filing date to representation increased through 2026 Q1 before declining from 2026 Q1 to 2026 Q2. Specifically, the median time to representation increased from 260 days in 2024 Q1 to 477 days by 2026 Q2, a change of 217 days overall. The median time to representation increased from 260 days in 2024 Q1 to a peak of 618 days in 2026 Q1, then declined to 477 days by 2026 Q2. The largest increase occurred between 2025 Q1 and 2025 Q2 (84 days), while the largest decrease occurred between 2026 Q1 and 2026 Q2 (141 days).
The total number of people with NTAs filed in the same year is fixed, while the number among them who eventually gain representation cannot decrease and is expected to grow, though it is difficult to know by how much, especially for the most recent NTA-year cohorts.
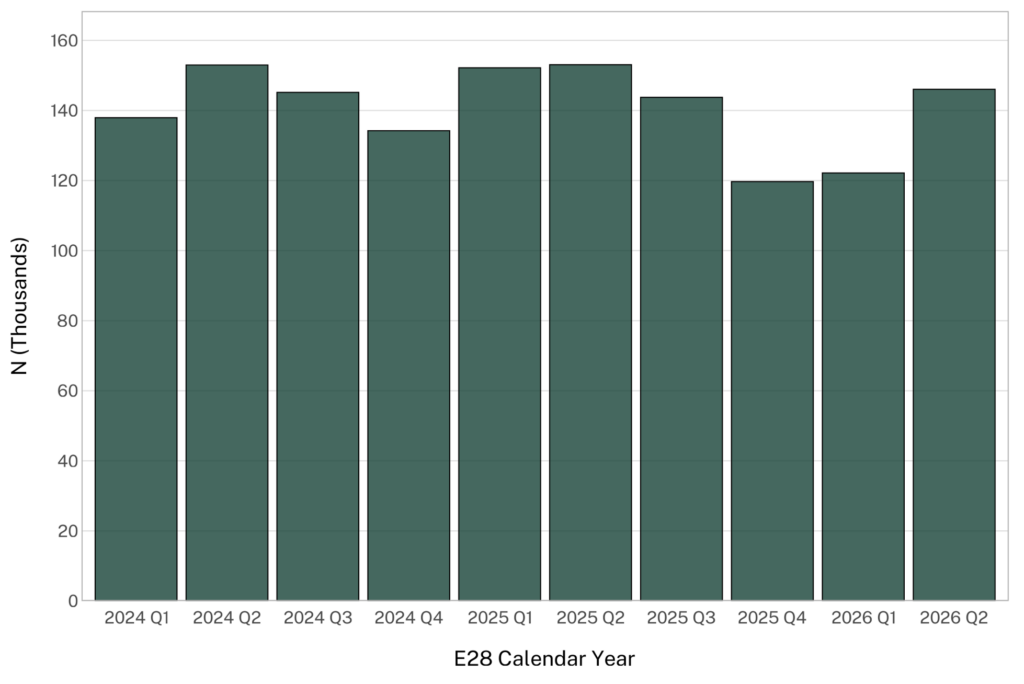
Another way to track historical trends in representation is to focus on the number of cases for which representation was initiated each year, as defined by the filing date of a new E-28 form in immigration court.
As Figure 3 shows, the number of representation initiations remained broadly stable overall, with some notable quarter-to-quarter changes, including an increase of 23,900 cases between 2026 Q1 and 2026 Q2 and a decrease of 24,100 cases between 2025 Q3 and 2025 Q4.
Figure 3. Case Representation Initiation
E-28 Year 2024 Q1 to 2026 Q2
Demographic Variation in Representation
This section compares representation rates and counts for people facing deportation in immigration court by primary language and alleged nationality. The analysis focuses on the ten languages and ten nationalities with the largest number of cases with an NTA since 2024 Q1.
For cases beginning between 2024 Q1 and 2026 Q2, 26% of respondents whose primary language was Spanish received representation, 7 percentage points lower than the average representation rate (see Figure 4). Spanish speakers comprised 77% of all cases during this period (approximately 2 million cases total). Only 22% of cases with respondents whose primary language was identified as Creole had representation at any point in their cases. Creole speakers accounted for 4% of total cases during this period.
Figure 4. Representation Rate by Language - Ten Largest Caseloads
NTA Calendar Year 2024 Q1 to 2026 Q2
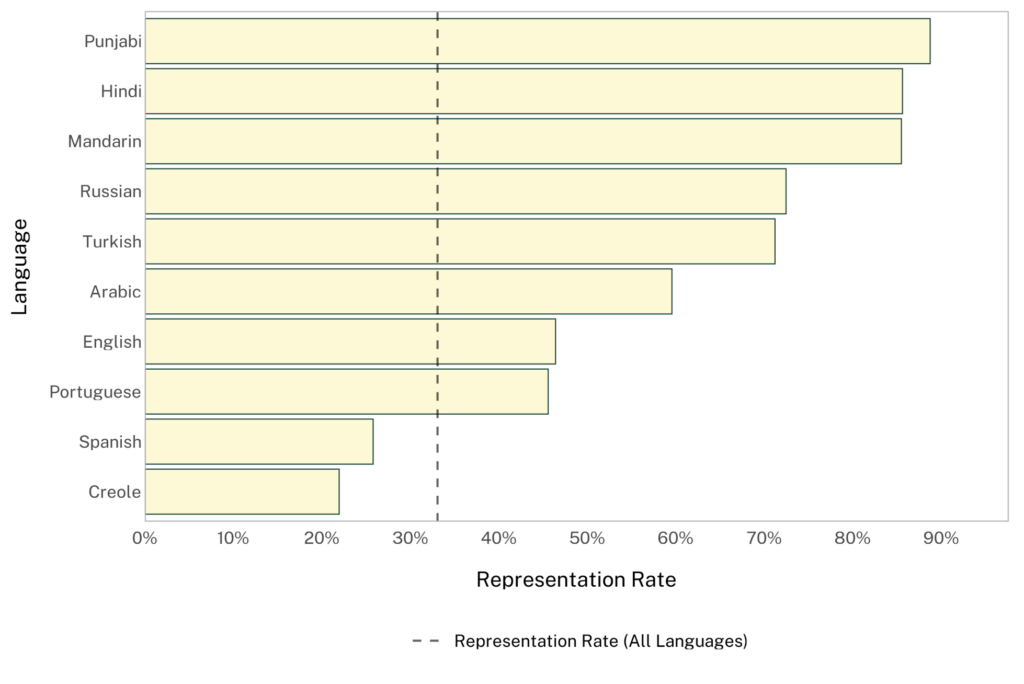
Figure 5 shows the representation rate for the ten nationalities with the most removal cases in immigration court from 2024 Q1 to 2026 Q2, as well as the representation rate across all nationalities (dotted line). As the figure shows, only two of the ten nationalities with the most cases had higher-than-average representation rates; that is, nationalities with the largest caseloads tended to be under-represented compared to respondents of other nationalities. Among the nationalities with the largest caseloads, only Guatemala and El Salvador—8.1% and 3.0% of cases in the period, respectively—had above-average representation rates (see Figure 5).
Figure 5. Representation Rate by Nationality - Ten Largest Caseloads
NTA Calendar Year 2024 Q1 to 2026 Q2
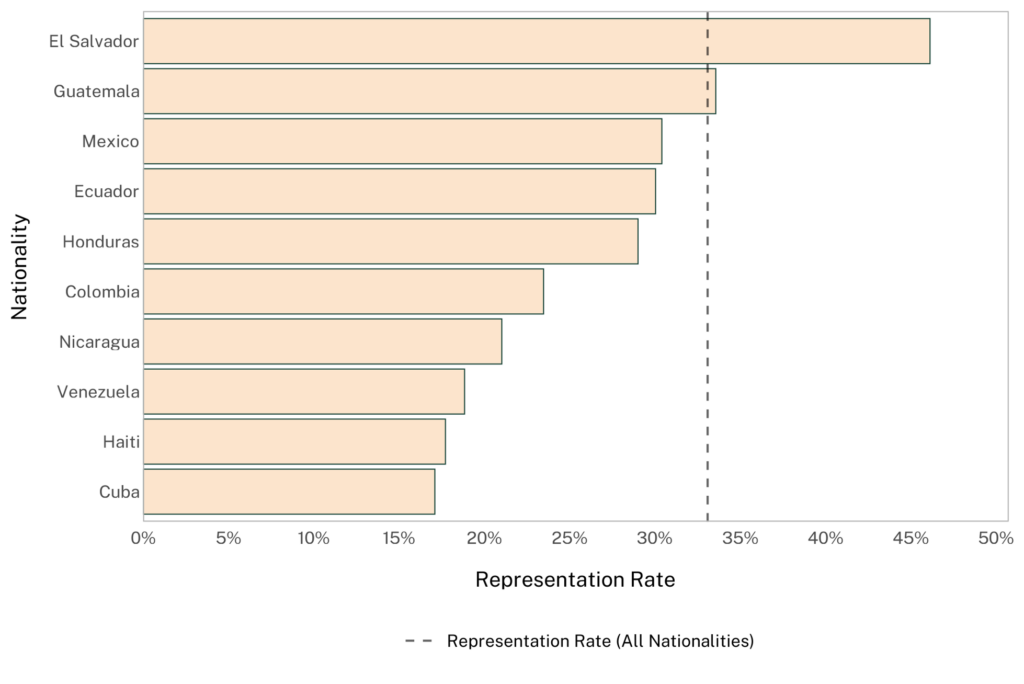
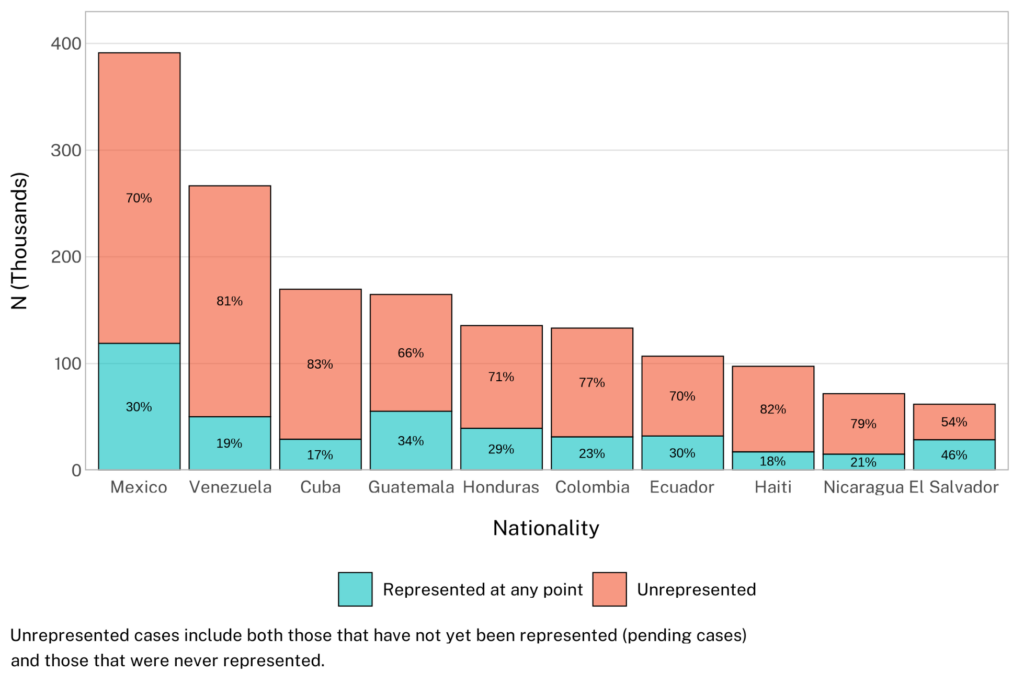
Figure 6 plots the total number of cases on the y-axis, while showing the same representation rates in text labels on the bars. Among the 10 countries with at least 50,000 cases with an NTA filed between 2024 Q1 and 2026 Q2, Cuba had the lowest representation rate (17%), while El Salvador had the highest representation rate (46%).
Figure 6. Total Number of Cases and Representation Rate by Nationality - Ten Largest Caseloads
NTA Calendar Year 2024 Q1 to 2026 Q2
Geographic Variation in Representation
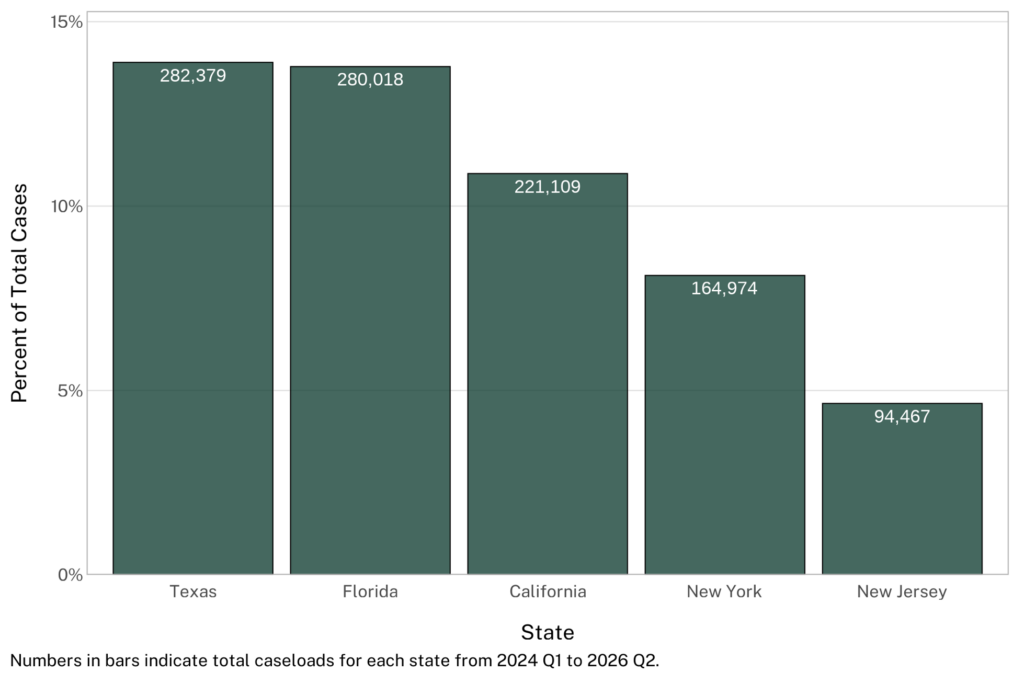
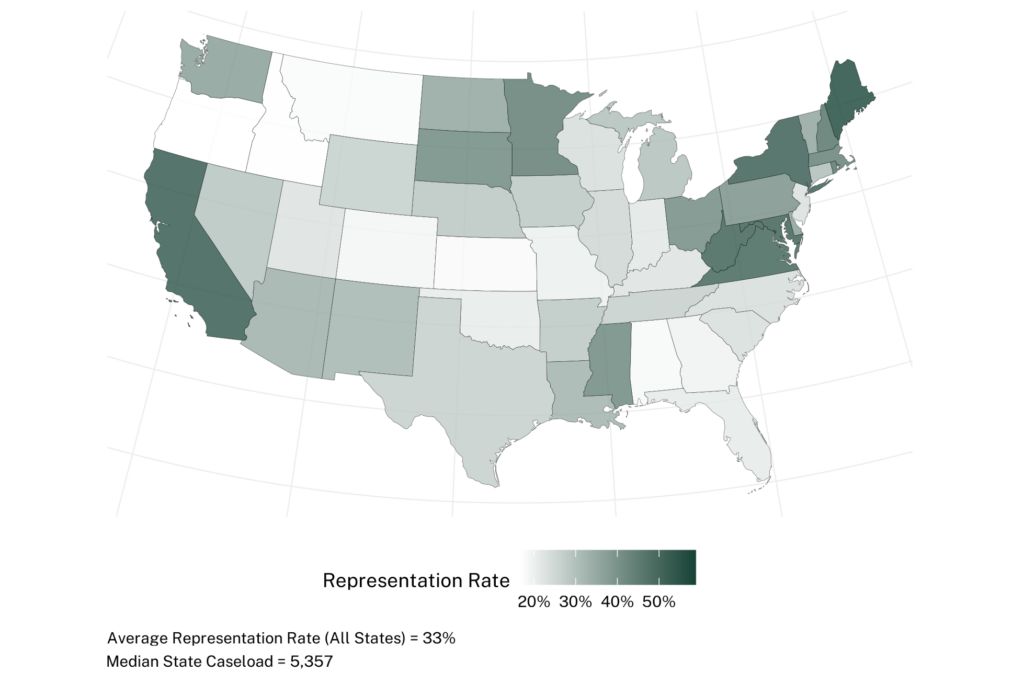
This section compares representation rates and counts for people facing deportation in immigration court by the U.S. state where they reside. Of cases which began between 2024 Q1 and 2026 Q2, people living in Maine, California, and District of Columbia had the highest representation rates of all states, at approximately 59% (see Figure 7; dark green). Those living in Montana, Idaho, and Oregon had the lowest representation rates, from 17% to 18% (pale green on the map). The states with the largest number of people facing deportation in immigration court included Texas, Florida, California, New York, and New Jersey (see Figure 8).
Figure 7. Representation Rate by U.S. State of Residence
NTA Calendar Year 2024 Q1 to 2026 Q2
Texas, Florida, California, New York, and New Jersey accounted for 51% of all removal cases that began between 2024 Q1 and 2026 Q2 (see Figure 8).
Figure 8. Percent and Number of Total Cases by State - Five Largest Caseloads
NTA Calendar Year 2024 Q1 to 2026 Q2