Fact Sheet
The Data Behind a Due Process Crisis: New Estimates of Unaccompanied Children in Immigration Court
Data Updated through August 2026
Overview
Since 2019, more than half a million unaccompanied children have been apprehended by U.S. immigration authorities and transferred into the care of the Office of Refugee Resettlement (ORR).1 Long recognized as a particularly vulnerable population, children who immigrated alone, or without an adult legal guardian are facing intensified threats, as thousands are placed into removal proceedings in immigration court where trained government attorneys seek their deportation.2 As the analysis here shows, these children and youth are often navigating these complex court proceedings alone, without the support of an attorney or legal representative and are being ordered removed at increasingly high levels.3 Even for those with legal representation, removal rates have grown substantially in recent years.
However, for nearly a decade, researchers, advocates, and policy makers have lacked regularly updated and reliable information on what is happening with these young people’s cases in immigration court. That’s because, after 2017 changes to a dedicated field used to identify unaccompanied children in the administrative database of the immigration court system became unreliable. Researchers at the Transactional Records Access Clearinghouse (TRAC) identified serious flaws in the field and encouraged the Executive Office for Immigration Review (EOIR) to correct the error but were unsuccessful. As a result, they ceased updating their Unaccompanied Juveniles data tool and questioned EOIR’s “ability to meaningfully and reliably report on juveniles in its caseload.” Since then, the minimal and flawed statistics on unaccompanied children reported by EOIR have been the only regularly updated source of data on this population in immigration court. To address these limits and understand what’s happening to unaccompanied children’s cases, a small number of academics and researchers at non-profit organizations have recently developed methods of identifying unaccompanied children in the EOIR data.4
This fact sheet helps to bring our understanding of what is happening to unaccompanied children in immigration court up to the present. Acacia’s new estimates of unaccompanied children in immigration court are based on the replication and update of a method developed by Chiara Galli of the University of Chicago and Tatiana Padilla of Rutgers University. Acacia has been in conversation with the researchers to better understand their estimation method, as published in a 2025 International Migration Review article, and has updated their estimates—which extend through March 2023—through August 2026.5 Updating Galli and Padilla’s novel approach required the manual categorization of court dockets as “Juvenile,” “Family,” and “Detained Adult” for hearing locations that were added after the period of their analysis.6
The new analysis below presents preliminary descriptive statistics and data visualizations of the case outcomes, representation status, and geographic distribution of unaccompanied children with removal cases in U.S. immigration court.7 It shows a sharp increase in the number and share of unaccompanied children receiving removal orders during the first 20 months of the second Trump administration. After averaging 28% from 2021 through 2024, almost half of unaccompanied children’s cases in 2025 and almost seven out of ten cases initially completed during the first eight months of 2026 received a removal order. The analysis also shows that representation matters. During the period of analysis, more than three-fourths of completed unaccompanied children’s cases that never had representation ended with a removal order. That’s more than four and a half times the removal rate for children who had representation at some point during their case.
Case Outcomes
The first set of statistics show counts of initial case completions for unaccompanied children over the past nine years and eight months (January 2017 through August 2026).8
After declining from 2019 through 2020, the total number of initial completions in cases with unaccompanied child respondents in immigration court (counting administrative closures and dismissals due to DHS failure to prosecute) grew to a peak of 82,309 in 2023 (see Table 1).
Despite the decline in the number of cases completed, there has been an increase in the number of removal orders for unaccompanied children’s cases over the last few years, from a recent low of 3,905 in 2021 to 29,728 in 2025 and 29,943 in the first eight months of 2026 alone (see Table 1).
Similarly, though quite small in absolute numbers, voluntary departures for unaccompanied children have grown from 527 in 2024 to 1,584 in 2025 and have already reached 1,831 in the first eight months of 2026. Notably the number of voluntary departures for unaccompanied children was also quite high during the first Trump administration, reaching 1,870 in 2019 by our estimates.
Table 1. Unaccompanied Children Outcomes (Counts)
By Calendar Year of Initial Completion
| Required to Depart | Allowed to Remain | ||||||
|---|---|---|---|---|---|---|---|
| Initial Comp. Year |
Removal | Voluntary Departure |
Relief Granted |
Term./ Dismissal |
Admin. Closure |
Failure to Prosecute (DHS cases only) |
Total |
| 2017 | 12,863 | 1,189 | 822 | 2,995 | 9,865 | 7 | 27,741 |
| 2018 | 14,515 | 1,638 | 871 | 3,373 | 2,575 | 38 | 23,010 |
| 2019 | 22,733 | 1,870 | 1,217 | 3,779 | 343 | 1,020 | 30,962 |
| 2020 | 7,891 | 534 | 685 | 3,101 | 851 | 379 | 13,441 |
| 2021 | 3,905 | 329 | 2,202 | 19,643 | 2,316 | 975 | 29,370 |
| 2022 | 18,407 | 534 | 2,022 | 33,096 | 7,764 | 1,661 | 63,484 |
| 2023 | 30,316 | 510 | 1,528 | 40,475 | 6,881 | 2,599 | 82,309 |
| 2024 | 23,954 | 527 | 1,204 | 42,445 | 4,255 | 2,392 | 74,777 |
| 2025 | 29,728 | 1,584 | 596 | 22,005 | 3,733 | 4,302 | 61,948 |
| 2026* | 29,943 | 1,831 | 301 | 9,351 | 956 | 1,248 | 43,630 |
| *Through August 31, 2026. | |||||||
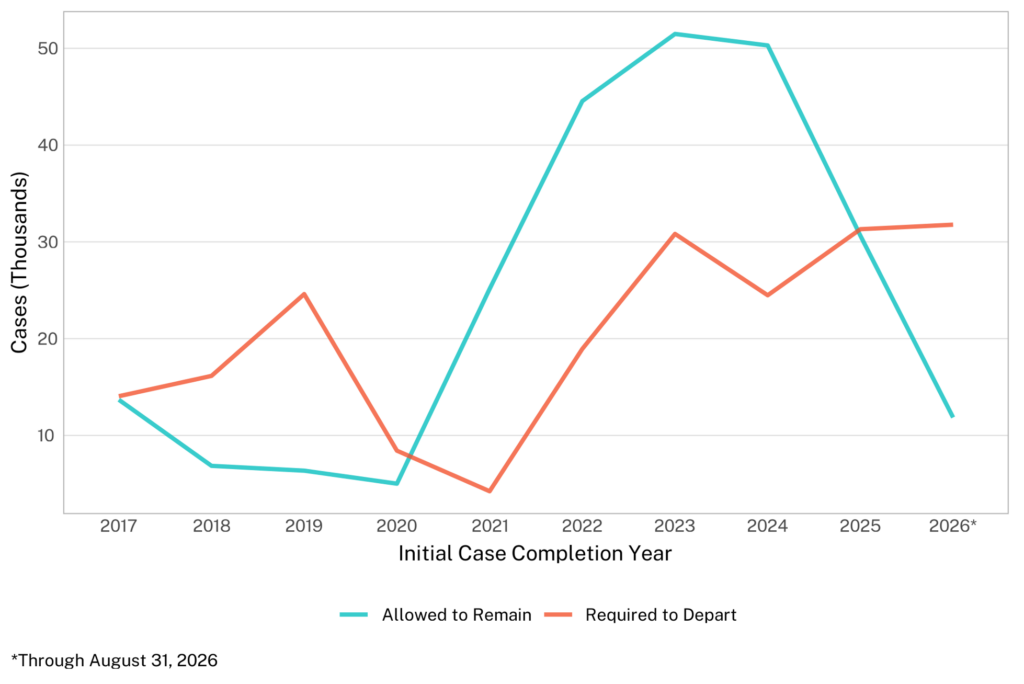
To allow for a more simplified view of the trends in outcomes, the analysis consolidates outcomes presented into two larger categories: 1) “Required to Depart” and 2) “Allowed to Remain” (these groupings are also reflected in Table 1). As Figure 1 shows, the number of unaccompanied children required to depart and allowed to remain has fluctuated considerably. While the number required to depart exceeded those allowed to remain from 2017 through 2020, that pattern reversed from 2021 through 2024 when far more unaccompanied children had immigration court outcomes that allowed them to remain in the country. In 2025 and the first eight months of 2026, however, the number allowed to remain has fallen sharply as the number required to depart has continued to climb.
Figure 1. The Number of Unaccompanied Children Allowed to Remain Declines Sharply as the Number Required to Depart Continues to Grow
The second set of statistics expresses each outcome as a percentage of all initial case completions. Specifically, we calculate the percentage of each outcome category in each year (see Table 2). Calculating percentages allows for comparison of outcomes across years, irrespective of the total number of initial case completions in any year.
Removal orders reached a low of 13% in 2021, then increased during the remainder of the Biden administration, averaging 28% from 2021 through 2024.
The increase has been stark during the post-Biden period, reaching 48% in 2025 and 69% in the first eight months of 2026.
Voluntary departures averaged 1% during the Biden administration, then reached 3% in 2025 and 4% in the first eight months of 2026 of unaccompanied children’s cases.
During the Biden administration, the most common outcome for unaccompanied children’s cases in immigration court was termination or dismissal, typically to allow children and youth to pursue affirmative relief such as Special Immigrant Juvenile Status (SIJS) or Asylum with USCIS. The percentage of cases ending with a termination or dismissal reached a high of 67% in 2021, averaged 56% during the Biden years, and declined to 36% in 2025 and 21% in the first eight months of 2026.
Relief within immigration court–consistently quite low–accounted for a minuscule 0.7% of cases during the first eight months of 2026.
Table 2. Unaccompanied Children Outcomes (Percent)
By Calendar Year of Initial Case Completion
| Required to Depart | Allowed to Remain | |||||
|---|---|---|---|---|---|---|
| Initial Comp. Year |
Removal | Voluntary Departure |
Relief Granted |
Term./ Dismissal |
Admin. Closure |
Failure to Prosecute (DHS cases only) |
| 2017 | 46.4% | 4.3% | 3.0% | 10.8% | 35.6% | 0.0% |
| 2018 | 63.1% | 7.1% | 3.8% | 14.7% | 11.2% | 0.2% |
| 2019 | 73.4% | 6.0% | 3.9% | 12.2% | 1.1% | 3.3% |
| 2020 | 58.7% | 4.0% | 5.1% | 23.1% | 6.3% | 2.8% |
| 2021 | 13.3% | 1.1% | 7.5% | 66.9% | 7.9% | 3.3% |
| 2022 | 29.0% | 0.8% | 3.2% | 52.1% | 12.2% | 2.6% |
| 2023 | 36.8% | 0.6% | 1.9% | 49.2% | 8.4% | 3.2% |
| 2024 | 32.0% | 0.7% | 1.6% | 56.8% | 5.7% | 3.2% |
| 2025 | 48.0% | 2.6% | 1.0% | 35.5% | 6.0% | 6.9% |
| 2026* | 68.6% | 4.2% | 0.7% | 21.4% | 2.2% | 2.9% |
| *Through August 31, 2026. | ||||||
Removal Orders by Representation
Next, we focus on removal orders by representation. Representation is measured using a simple and conservative method that identifies those cases that had representation at some point (as defined by the filing of an E-28 form) and those that never had representation.9
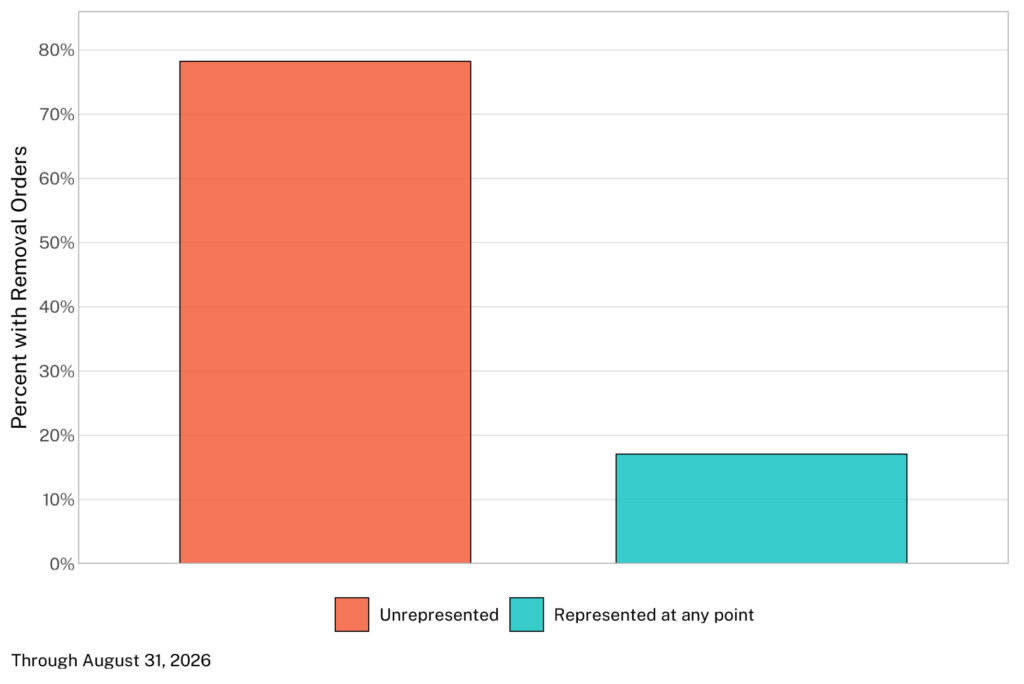
Unaccompanied children’s cases that have ever had representation are far less likely to end in a removal order. From 2017 through August 2026, 17% of completed, represented cases received a removal order, compared to 78% of cases that were never represented (see Figure 2).
Figure 2. Unaccompanied Children with Representation are Far Less Likely to Receive a Removal Order in Immigration Court, Initial Case Completions from 2017 to August 2026
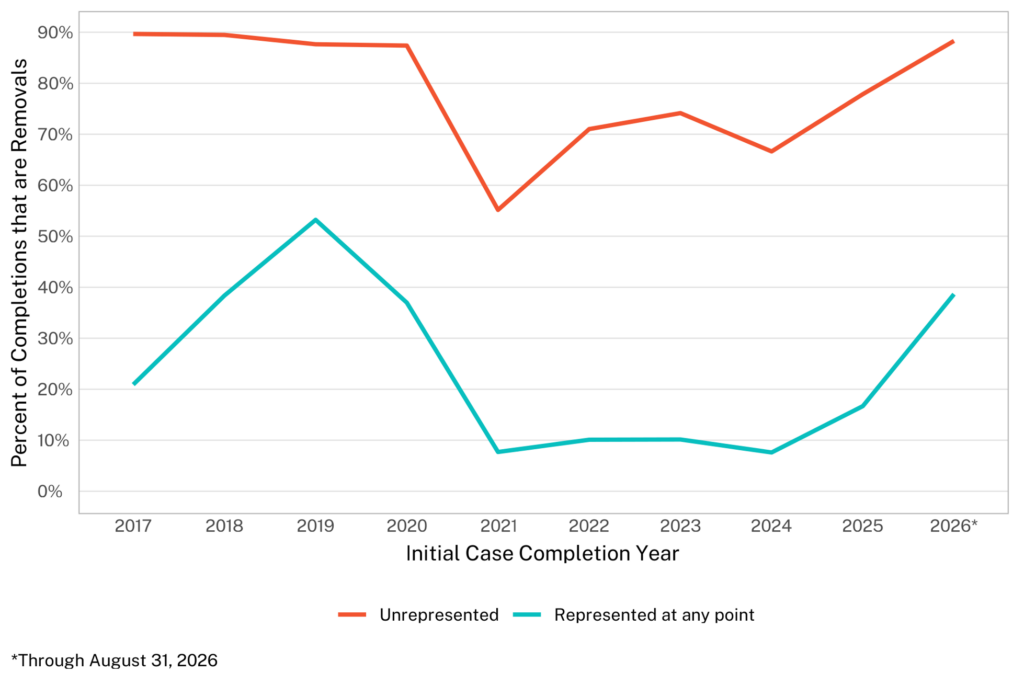
However, beginning in 2025, removal began to increase for unaccompanied children irrespective of whether they ever had representation. Specifically, the removal rate of children who ever had representation grew from below ten percent in 2024, to 17% in 2025 and 39% in 2026 to date. For unrepresented unaccompanied children, the removal rate grew from more than two-thirds of cases in 2024 to 78% in 2025 and 88% in 2026 to date. Strikingly, the rate of increase was even steeper for represented cases (see Figure 3).
Figure 3. Removal Rates are Always Higher for Unrepresented Unaccompanied Children, But Fluctuate Historically
Representation and Caseloads by State
Of the more than 110,000 unaccompanied children’s cases still pending as of August 31, 2026, those living in Maryland, Ohio, and West Virginia had the highest representation rates of all states, at approximately 86% (see Figure 4; dark green). Those living in South Carolina, Montana, and Idaho had the lowest representation rates, from 26% to 20% (pale green on the map).
Figure 4. Representation Rate for Pending Unaccompanied Children Cases by State
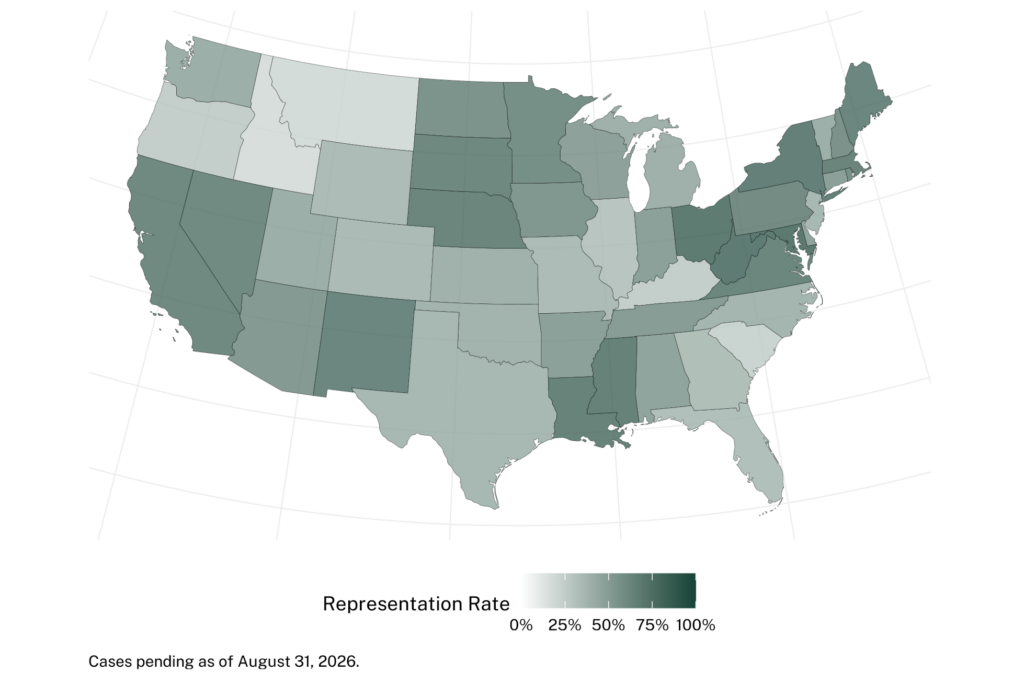
Of cases still pending as of August 2026, people living in Maryland, Ohio, and West Virginia had the highest representation rates of all states, from 87% to 85% (see Figure 4; dark green). Those living in South Carolina, Montana, and Idaho had the lowest representation rates, ranging from 27% to 20% (pale green on the map).
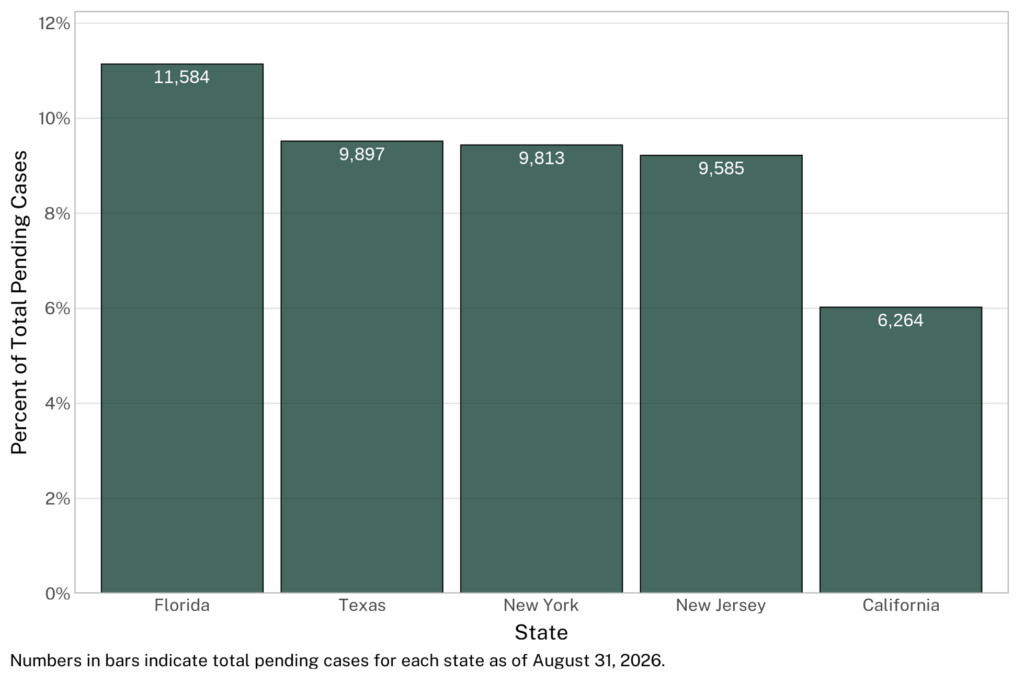
The states with the largest number of unaccompanied children facing deportation in immigration court included California, Florida, New Jersey, New York, and Texas, accounting for 45% of all unaccompanied children removal cases still pending as of August 2026 (see Figure 5).
Figure 5. Percent and Number of Total Unaccompanied Children Cases by State - Five Largest Caseloads