Fact Sheet
Trends in Case Times of People Facing Deportation in U.S. Immigration Court, Through December 2025
Overview
This fact sheet presents original analysis of historical data and recent trends in the case times in U.S. immigration courts. For the purposes of this fact sheet, case time is defined as the time from initial hearing to initial decision of an immigration judge. Where appropriate and feasible, we disaggregate the data by nationality, language, detention status (i.e., whether the case was detained when the initial decision was delivered), and state.
This document is one of a series of short, thematic, issue-focused fact sheets highlighting key statistics on legal access and due process in immigration court. They are based on original Acacia analysis of data from the EOIR administrative Case database (Case). The purpose of these fact sheets is to present regularly updated data on a set of key metrics in historical context.
This fact sheet presents the data and explain the visualizations in ways that are clear and compelling, while taking care to guard against misinterpretation and the drawing of erroneous or misleading inferences. Importantly, the statistics reported are descriptive in nature and users should thus take care to avoid ascribing causality to the trends and patterns observed in the data.
Historical Trends in Case Times
Measuring the median time from the initial hearing on a case to the initial decision by an immigration judge (IJ) is a good indicator of how long it takes a typical case to reach completion in immigration court, with higher medians signifying that cases decided in those years had generally been pending for longer periods.
The median time from initial hearing to the IJ’s initial decision on the case rose from fewer than 22 days in 2008 to 345 days in 2016, before declining to 118 days in 2019. The median time from initial hearing to initial case completion then spiked to peak at 822 days in 2021 before beginning to decline consistently thereafter (see Figure 1).
Figure 1. Median Time and Interquartile Range from Initial Hearing to Initial Decision Calendar Year 2008 - 2025
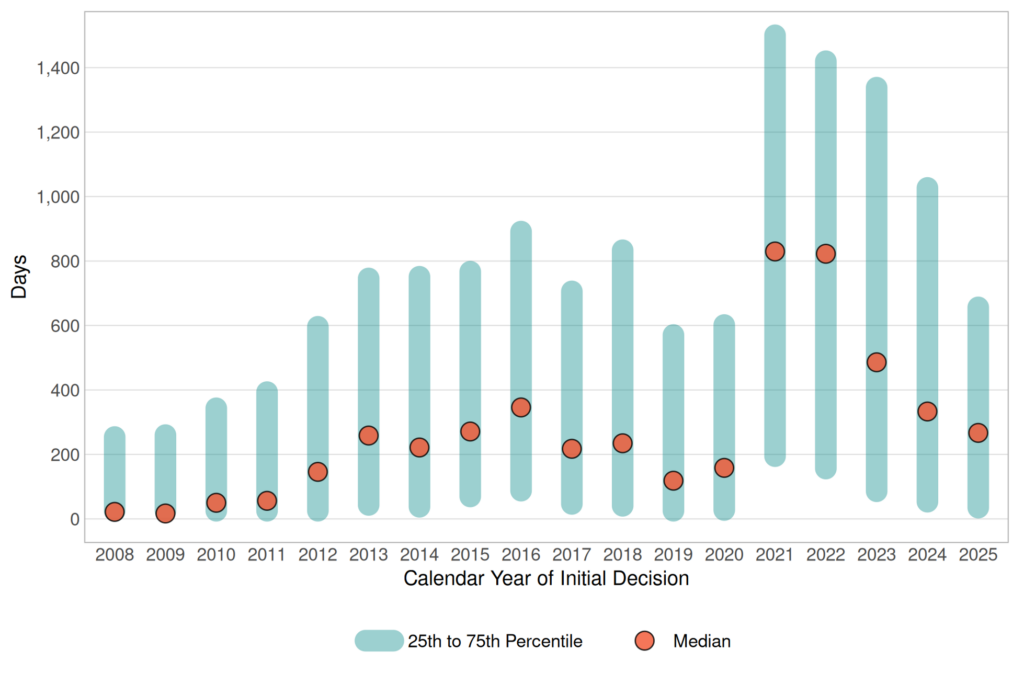
While half of cases during this period have times greater than the median (by definition), it should also be noted that while the time between an initial hearing and an initial decision is in theory unlimited, the shortest possible case time is zero days (i.e., cases with an initial IJ decision at the first hearing). For this reason, many of the cases below the median have substantially shorter case times than the median itself. The 75th percentile of time from initial hearing to initial decision ranged from 259 days longer than the median (in 2008) to as many as 697 days longer than the median (in 2021), before declining to 416 days longer than the median in 2025.
The typical unrepresented case was substantially shorter than the time for represented cases across the period of analysis (2008 through 2025). The median time for unrepresented cases rose from zero days in 2008 to 59 days in 2016, declining to eight in 2020 (see Figure 2). Since 2020, the median time for unrepresented cases has risen from eight to 110 days. Concurrently, the median time for represented cases has declined from 1,210 days in 2022 (after spiking from 493 days in 2020) to 618 days in 2025.
Figure 2. Median Time from Initial Hearing to Initial Decision by Representation Status Calendar Year 2008 - 2025
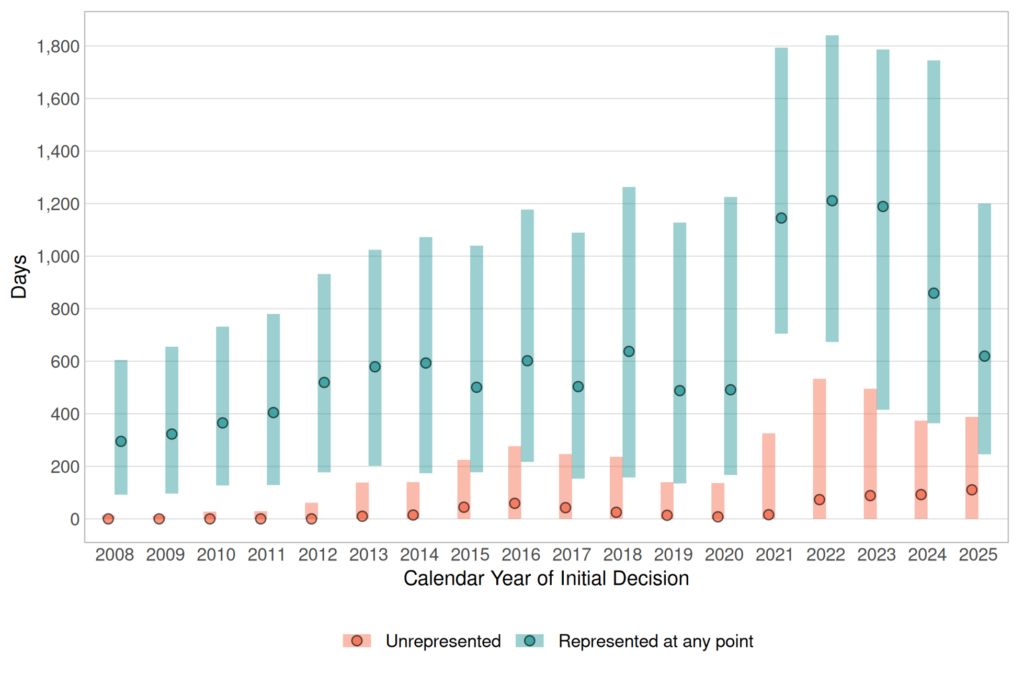
There are multiple factors that may contribute to longer case times, such as occurred in 2021 and 2022 (see Figure 1). The growth of the immigration court backlog, which parallels this increase in case times, has contributed to adjudication delays that are connected to Immigration Judge (IJ) turnover and onboarding among other administrative challenges.1 Represented cases may take longer due to the time that petitioners spend searching for attorneys after the initial hearing.2 The cases of people with attorneys can also last longer because lawyers have the expertise to zealously advocate for their clients’ interests. For example, petitioners with legal counsel are more likely to file for continuances, which provide time to gather the information needed to provide a well-substantiated plea for relief.3
Figure 3. Median Time and Interquartile Range from Initial Hearing to Initial Decision for Adults by Detention Status Calendar Year 2008 - 2025
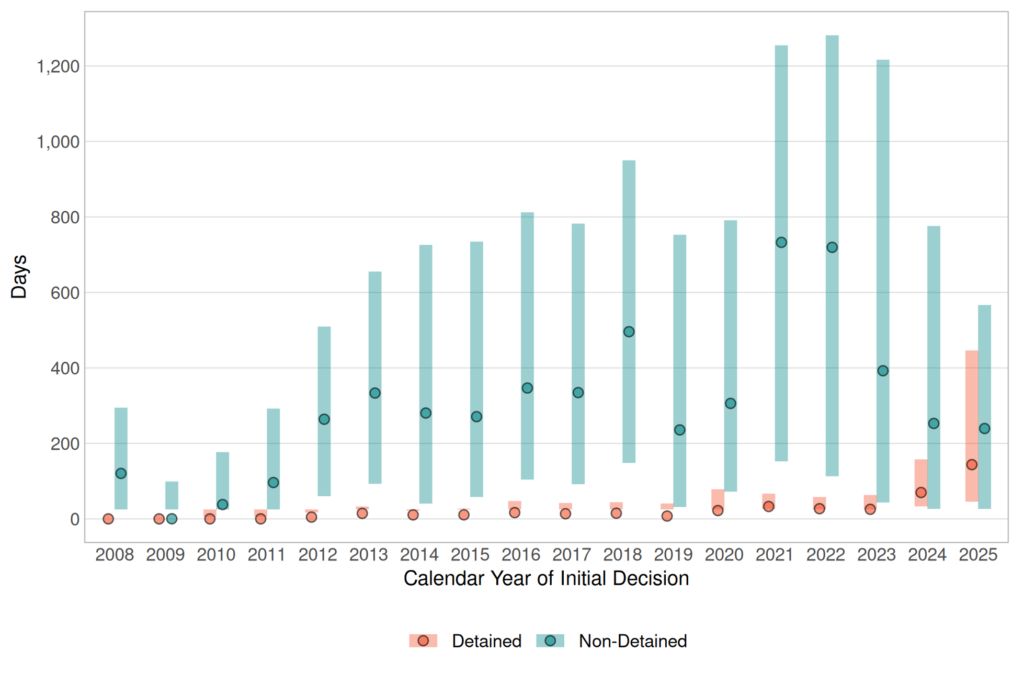
The median time from initial hearing to initial decision was substantially lower for detained cases than for non-detained cases for much of the period of study. The median time for detained cases remained relatively consistent from 2008 to 2019, from zero days in 2008 to eight days in 2019 (see Figure 3). Since 2019, the median time for detained cases has risen precipitously from 22 in 2020 to 144 in 2025. Concurrently, the median time for nondetained cases has declined from 734 days in 2021 to 240 in 2025. The median difference in case time between detained and non-detained cases (93 days) was the lowest in 2025 since 2011.
Demographic Variation in Case Times
This section compares case times for people facing deportation in immigration court by primary language and alleged nationality. The analysis focuses on the ten languages and ten nationalities with the largest number of cases with an NTA since 2017.
Figure 4. Median Time from Initial Hearing to Initial Decision by Nationality, Ten Largest Caseloads Calendar Year 2017 - 2025
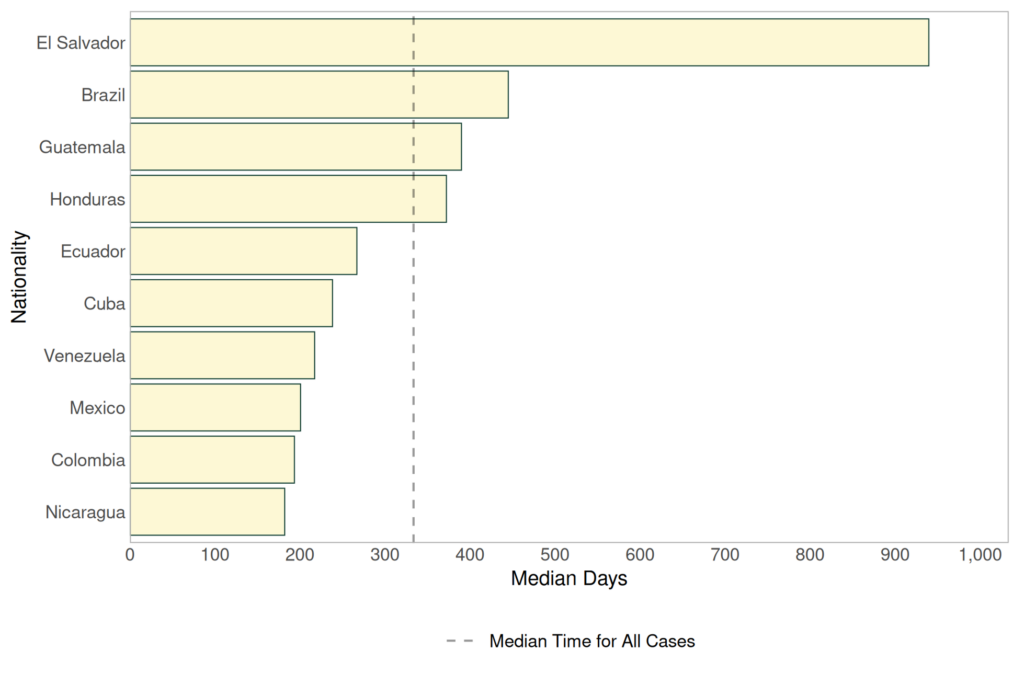
Figure 4 shows the median case time from initial hearing to initial decision, disaggregated by the nationalities with the ten largest caseloads. These nationalities had the ten largest caseloads with an initial decision from 2017 to July 2025. Of these nationalities, cases from El Salvador experienced a substantially higher median time (940 days) than all other nationalities—the next longest case times were Brazil, Guatemala, and Honduras (447, 390, and 370 days, respectively). All other nationalities among those with the largest caseloads had median times lower than the median for all cases (333 days).
Figure 5. Median Time from Initial Hearing to Initial Decision by Language, Ten Largest Caseloads Calendar Year 2017 - 2025
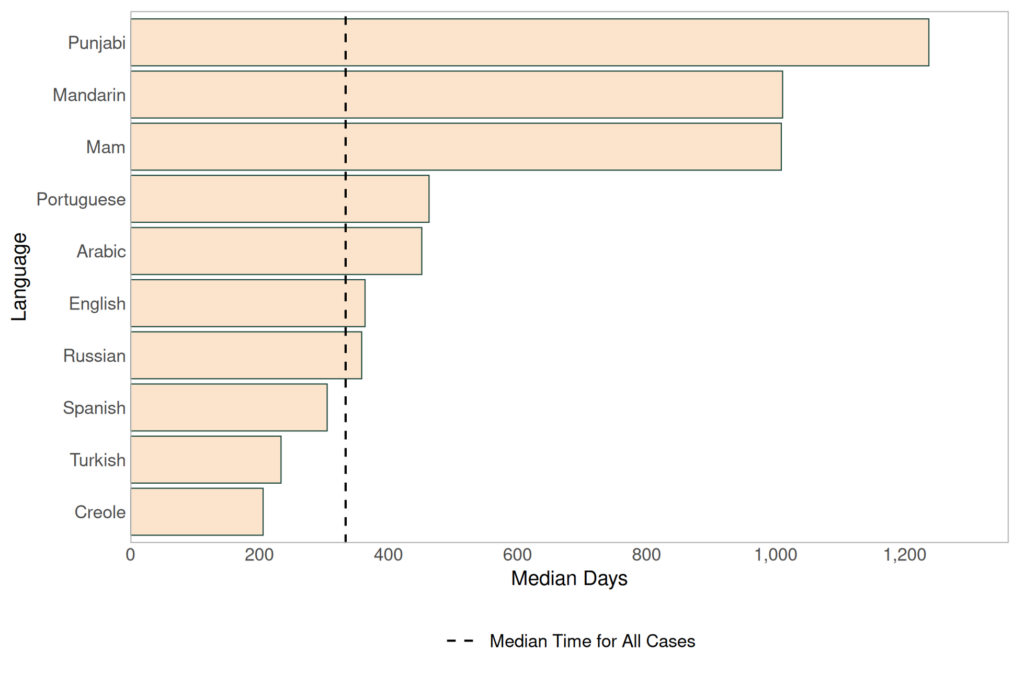
Figure 5 shows the median case time from initial hearing to initial decision, disaggregated by language. These languages had the ten largest caseloads with an initial decision from 2017 to July 2025. Of these languages, cases with primarily languages of Punjabi, Mam (an indigenous Mayan language), and Mandarin experienced a substantially higher median time (over 1,000 days) than all other nationalities. The next largest were Portuguese, Arabic, and Russian (464, 453, and 359 days, respectively). All other nationalities had median times lower than the median for all cases (333 days).
Figure 6. Median Time from Initial Hearing to Initial Decision, Adults and Minors Initial Decision Calendar Year 2017 - 2025
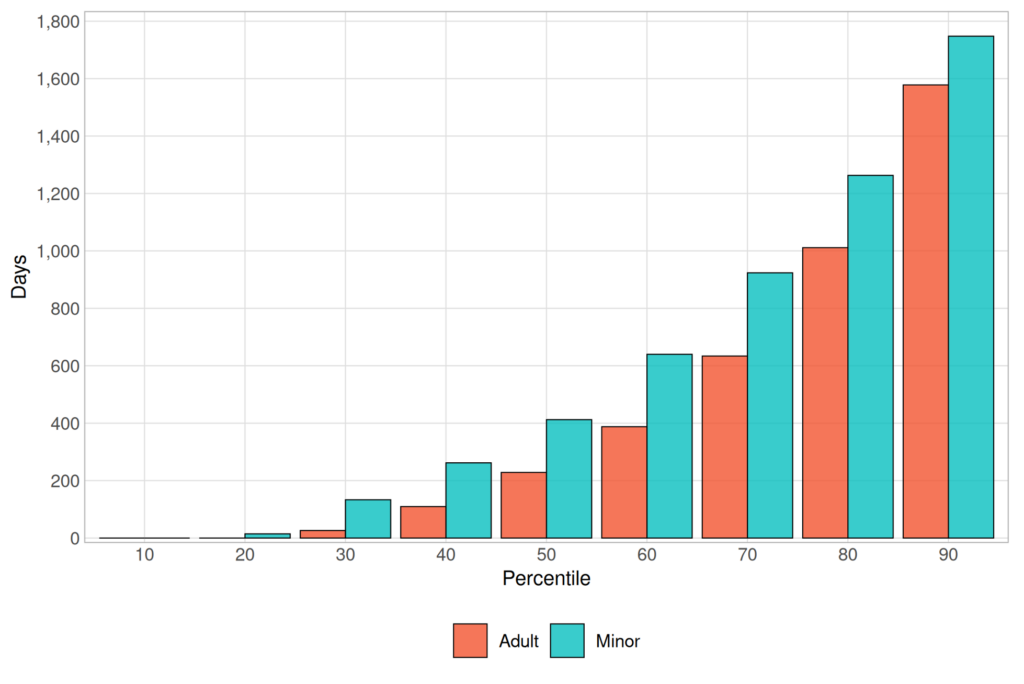
Figure 6 shows case times from initial hearing to initial decision, broken down by adults and minors (as defined by age when the notice to appear, NTA, was filed), for all cases which received an initial decision between 2017 and December 31, 2025. In general, cases for minors had been pending slightly longer than adult cases decided during this period (close to 200 days longer at the median).
Each decile on the x-axis can be interpreted as a percentile. For example, 30% of children’s cases received an initial decision within 133 days of the initial hearing; the median child’s case (50th percentile) was pending for 414 days; and 80% of children’s cases had received an initial hearing within nearly 1,266 days. On the other hand, 30% of adults’ cases received an initial decision rather quickly after their initial hearing; the median adult case was pending for 229 days; and 80% of adults’ cases received an initial decision in 1,012 days.
Geographic Variation in Case Times
This section compares representation rates and counts for people facing deportation in immigration court by the U.S. state where they reside.
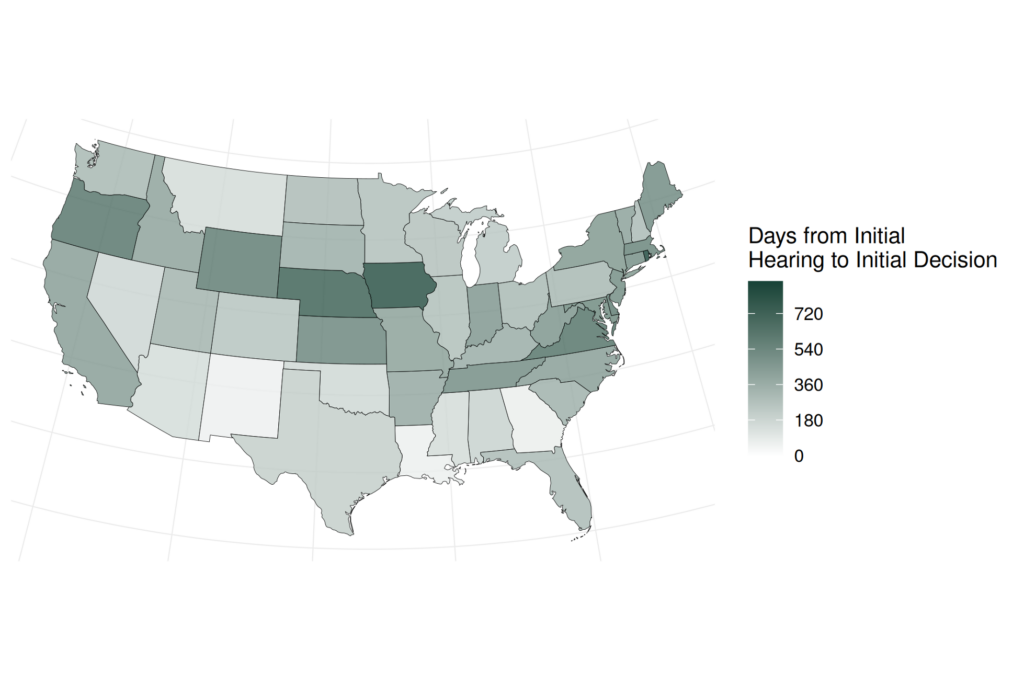
This map shows the median case time from initial hearing to initial decision by state from 2017 to 2025. Of the states with the largest caseloads, Arkansas and California were at or above the median state case time of roughly 385 days, while Alabama, Arizona, and Colorado were below the median.
Figure 7. Median Case Time by US State Calendar Year 2017 - 2025